How to capture information from browser developer tools Follow

To help with more complex troubleshooting, our Support team may ask you to capture information from your browser's developer tools.
Chrome Developer Tools should be enabled by a Google Admin to capture this information:
- Navigate to the impacted webpage to the point just before the issue occurs.
-
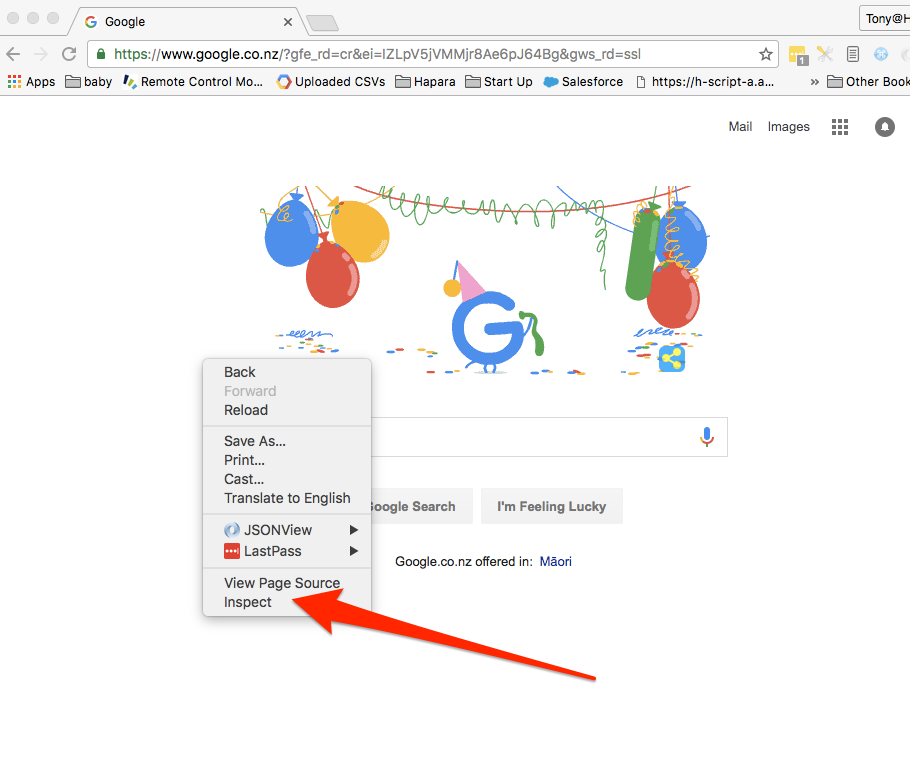
Right-click on the browser page, and select Inspect:
- The Developer Tools window will appear, either as part of your browser, or in a pop-up window.
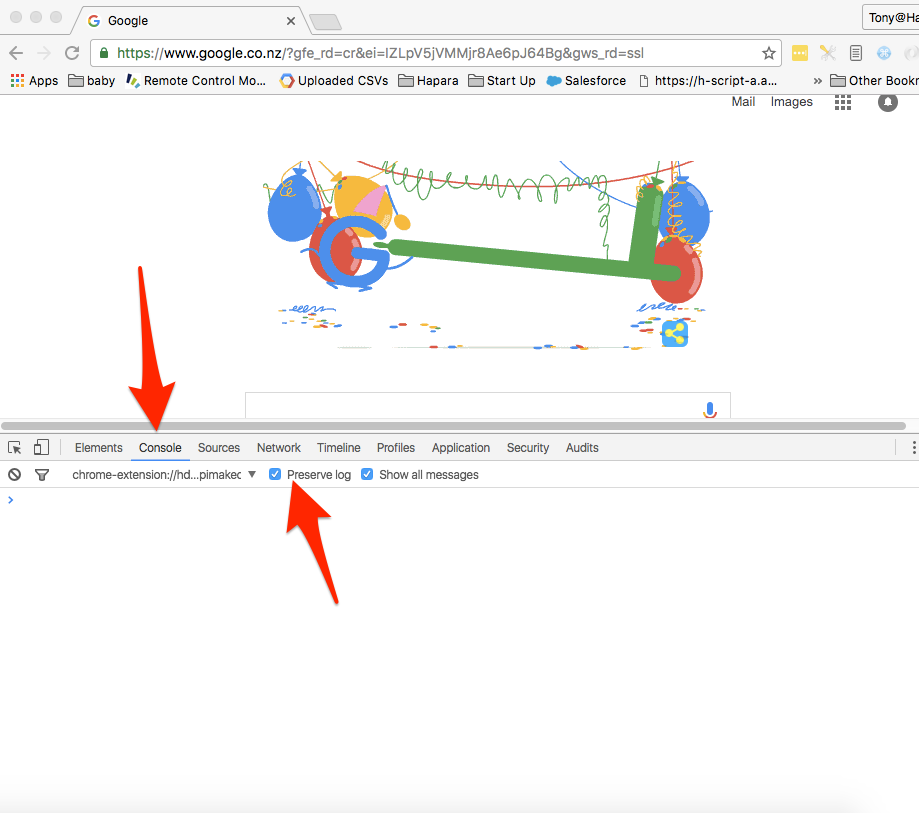
Click on the Console tab, and click the settings cog icon top right to enable Preserve log:
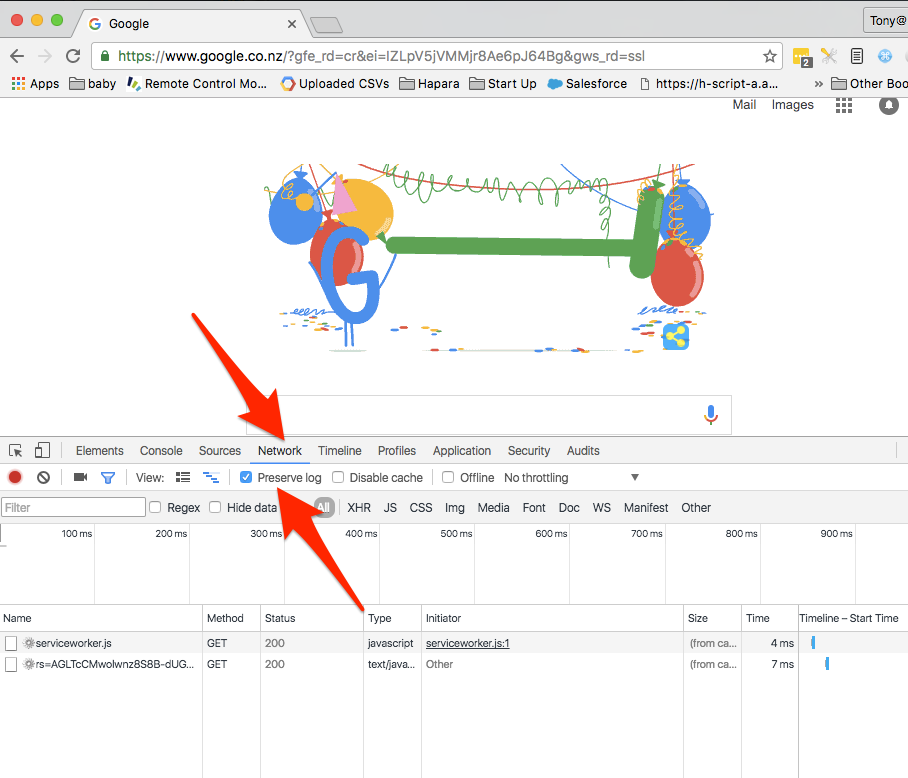
- Click on the Network tab and also ensure the Preserve log option on this page is enabled.
You can also enable Capture screenshots to snap images of the issue you're experiencing:
- Now replicate the action that causes the issue you've been experiencing. The Network and Console tabs should capture information occurring in the background as you replicate the issue.
- When you've completed replicating the issue, please download the captured data:
- From the Network tab, click the down arrow icon that says Export HAR... to save a .har file.
- From the Console tab view, you can right click and select Save as...to save a .log file.
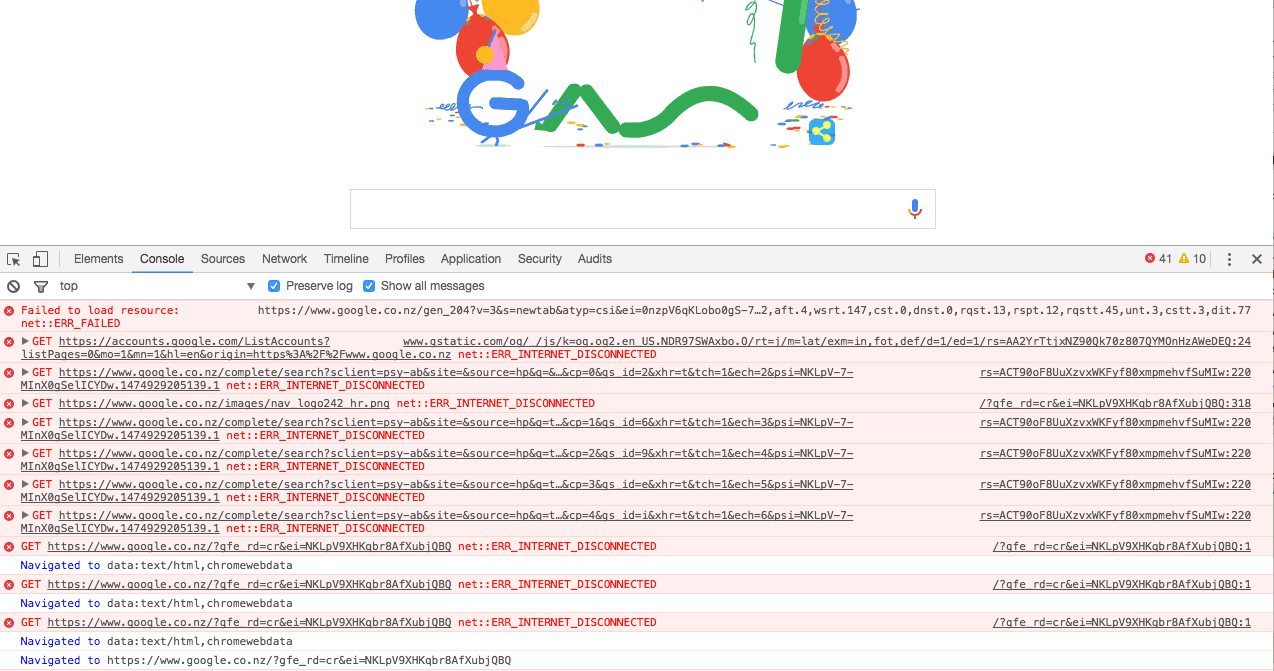
- If there are any red error entries in either the Network or Console tabs, take a screenshot of these to forward to our team.
- From the Network tab, click the down arrow icon that says Export HAR... to save a .har file.
-
Click this link which will compose an email to Hāpara Support.
Please attach the .har and .log files, any screenshots and relevant information, eg:
- Impacted email address(es).
- Link to webpage/URL these logs were collected from.
- Approx date and time these logs were collected.
- Any support reference numbers, eg: ticket number or link.
- Brief description of issue.